Introduction to 20-Market Depth
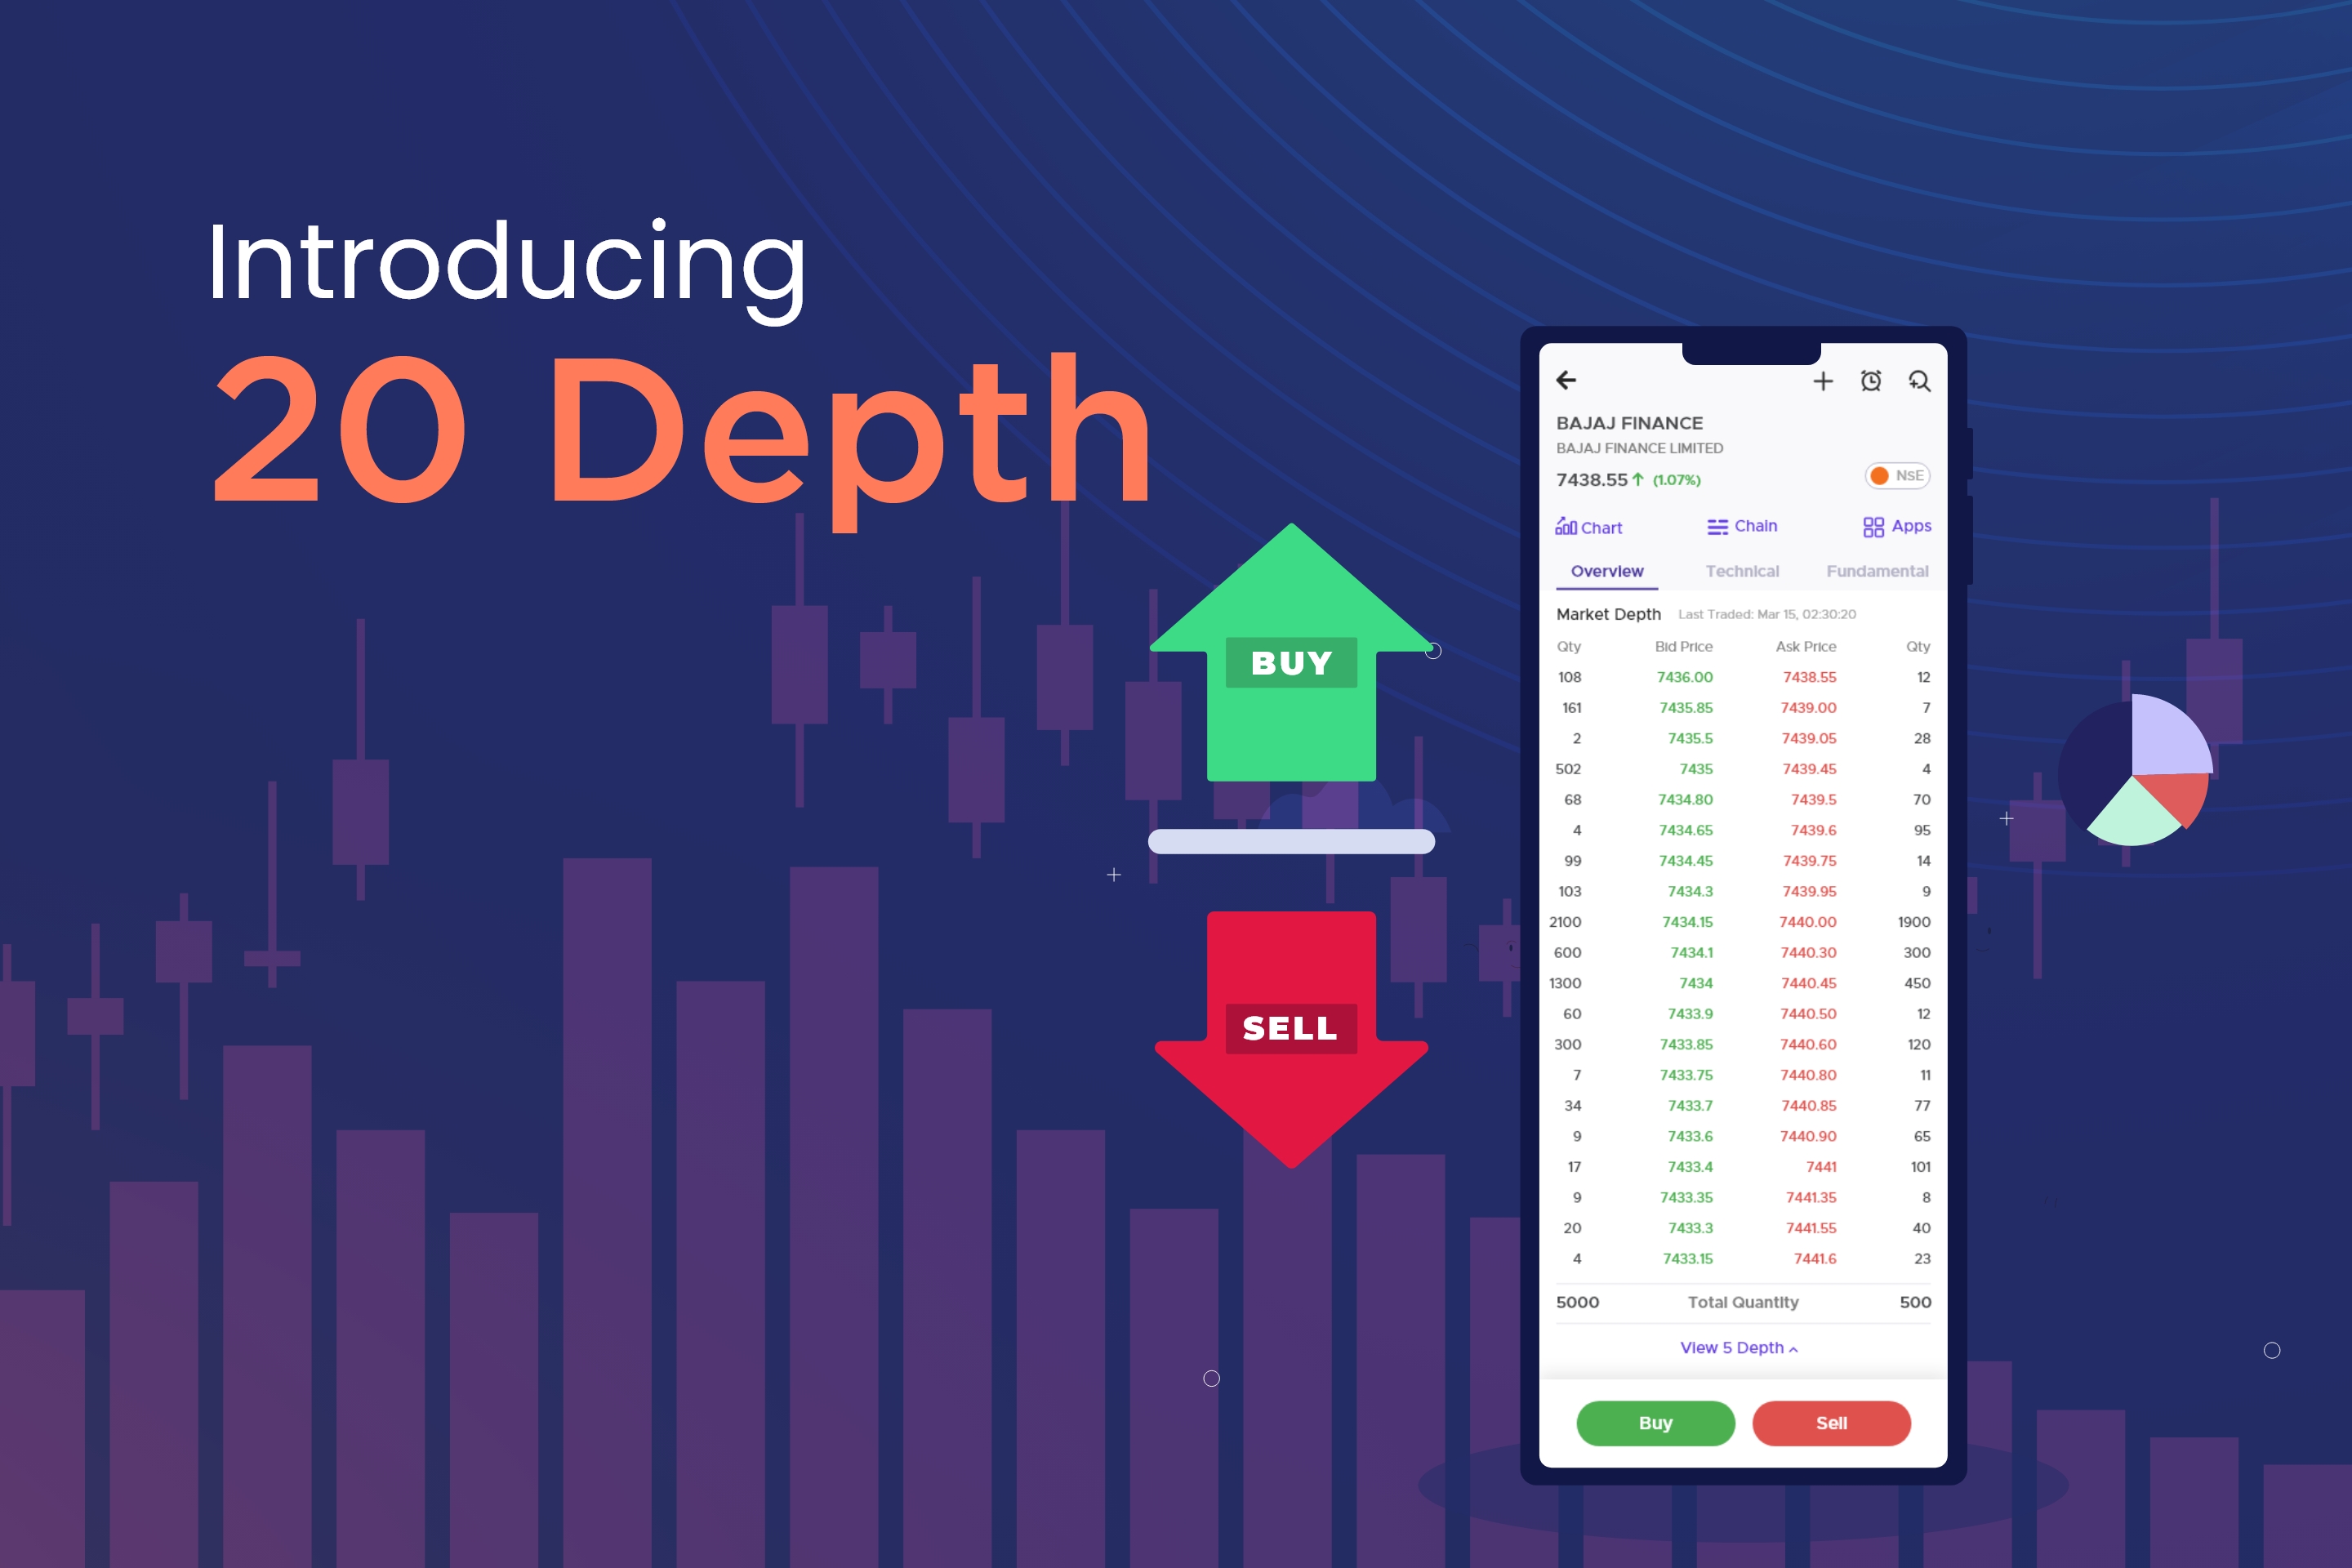
Market Depth
Market depth is expressed as the list of limit orders placed at different price levels for a particular security. It consists of 2 parts- Bid and Asks where Bid shows the number of Buy orders placed at a price level and Ask shows the number of Sell orders placed at a particular price level.
What is Level-3 Data/ 20-Market Depth?
According to NSE, all the real-time data is classified into 4 different levels which are; levels 1, 2 & 3, and tick by tick. The list of market depth is organized by price levels and it is updated in real-time to reflect current activity where Level 1 provides the best bid and best ask price, Level 2 offers up to five best bid and ask prices and Level 3 market depth offers a view of the twenty bids and asks. The default is 5 market depth and it gets updated every 3 times per second. The Indian Exchange provides the data to any trading clients and end users can avail it free of cost via IIFL Securities. Trading through only Level 2 or 5 Depth data is the same as estimating the depth of the ocean through the top view; it gives a brief overview but doesn't tell you the actual scenario of the market.
Let us understand how Level 3 Data is going to help us while trading:
1. Placing Large Orders
20-Depth Data is also useful in the case of when the customers want to place large orders. Let us see an example given below. I want to buy 5 shares of BAJAJ FINANCE. Looking at the market depth in the first picture, I know that placing the market order for 5 shares will get executed at the price of Rs 7,438.55 since there are sell orders placed for 12 shares at this price. But if I want to buy 100 shares of BAJAJ FINANCE, placing the order at the market price I don’t know what will be my average buy price, since 5 Depth is only showing the prices for the sell orders of 53 shares(12+7+28+4+2). Having an idea of where the maximum number of bids and asks will be placed across 20 depths as compared to 5 gives an edge to your trading skills and reduces the impact cost which is faced on large orders.
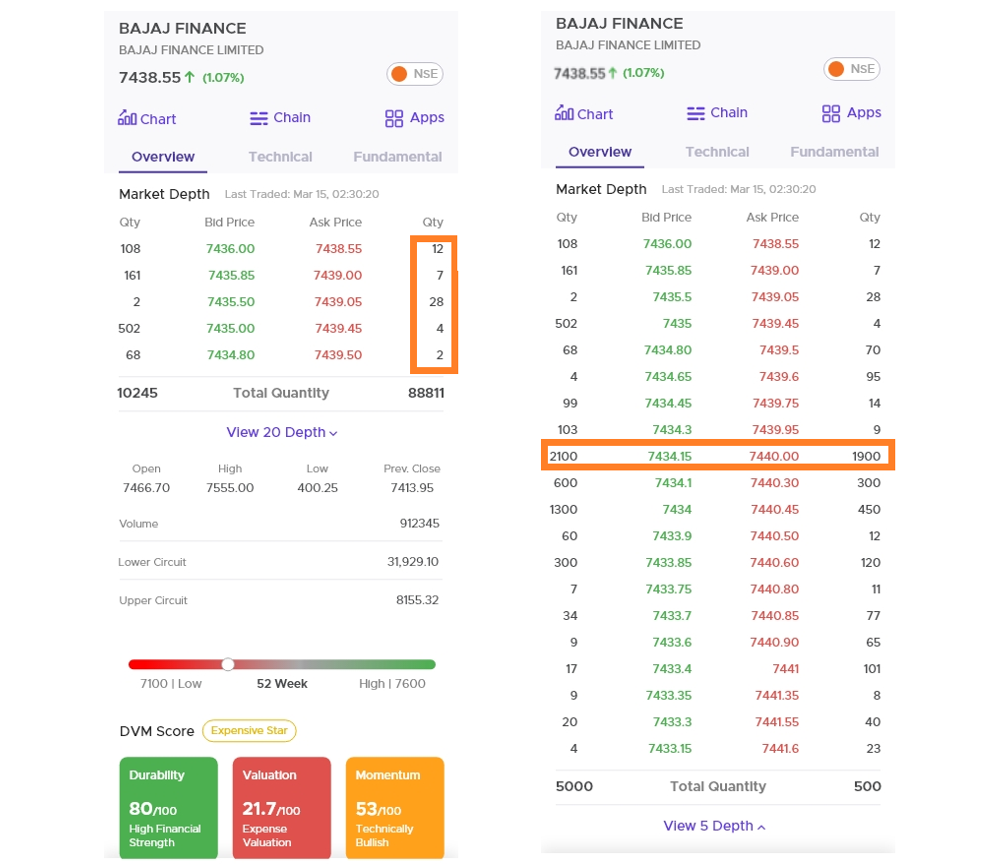
In the example above Let us calculate the average buying price while looking at just the 5 Depth-Data, In this case the average would be calculated by total sum of individual ask prices multiplied by the quantity and the whole divided by total quantity i.e. (7438.55 * 12 + 7439.00*7 +7439.05 *28 +7439.45*4 +7439.50*2)/(12+7+28+4+2) which in this case, the average buying price would be around 7,438.97 and if we look at at the 20- Depth Data the average price comes out to be 7440.17 which is closer to the price at which the order will get executed
3. Approximation of the number of Shares to Trade
One can also decide the optimum number of shares that he/she should buy/sell by just looking at the 20 depth market data (as the 20-Depth data shows more quantities that can be traded) based on the expected movement and volatility. Here two opposing forces are at work - 1. Higher quantity gives higher potential returns; 2. Increasing the quantity might increase your average buy/sell price, leading to lower returns.
In the example above, if I am expecting the price to reach 7450.00 -
Looking at 5 depth I can conclude that I can buy upto 53 shares(12+7+28+4+2).
Looking at 20 depth paints a different picture. I can buy ~2500 shares since a huge number of sell orders are placed around 7440.
4. To Place a Stop Loss/ Limit Order
In addition to the features we talked about before we can also use 20-depth data to understand the order placement i.e. what should be the Stop Loss or the price while placing a limit order. Let us take an example to understand that, suppose in the previous example you want to place the stop loss or the square-off price of your security that you had at 7438.00 , looking at the 20-Depth example here we see that most of the bids are concentrated at price 7434.15 and ask prices are concentrated at 7440.00, so if I would place a sell order I would prefer a stop loss below 7434.15 and aim above 7440.00 to minimize losses and maximize gains hence providing convenience
5. Estimation of the Support & Resistance Prices
20-Depth Data can help identify the Support and Resistance prices as support price lies around where most of the bid prices are concentrated whereas the resistance price lies around the price where most of the ask prices are concentrated. Let us see through the graph below where you can get the idea of the support price that lies somewhere around 7440 while if we see in the 20-Depth Data the bid prices are also concentrated around 7334.15 hence if we want to look for Support & Resistance Prices we can directly infer it from the 20-Depth data without referring the charts.

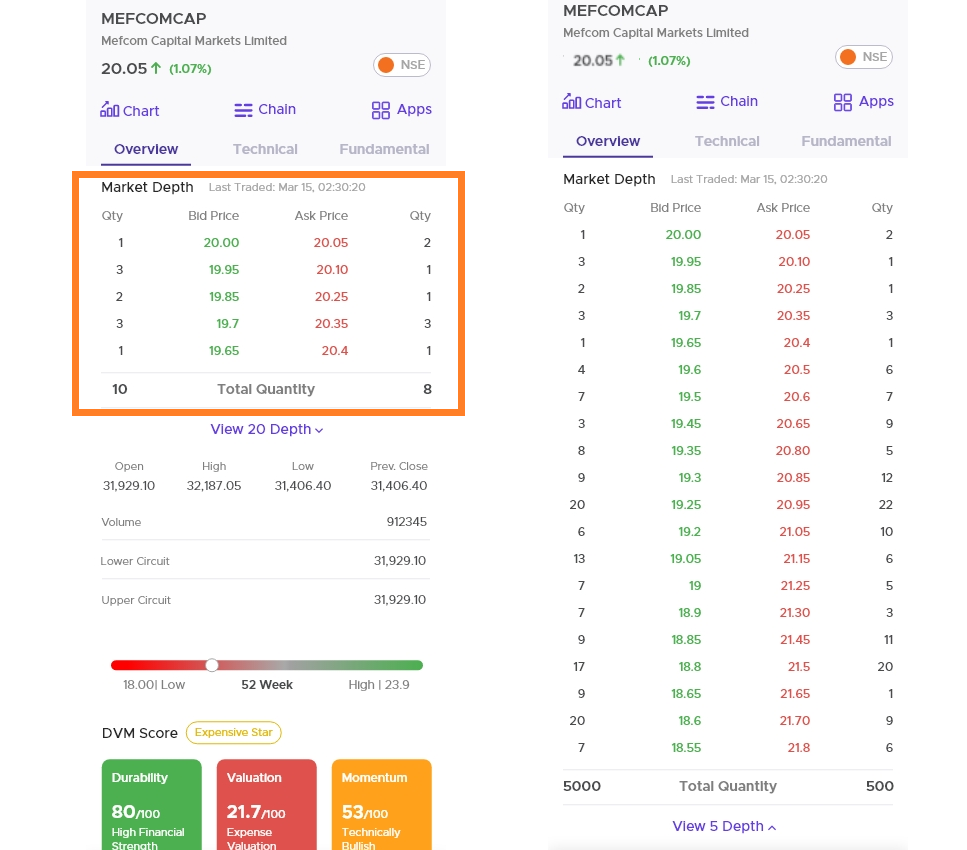
6. Accessing the availability of the Contracts
Any user who wants to trade, definitely wants to have a better outlook at the market, and 5-Depth data doesn’t give you the whole overview, this is especially in the case when someone wants to trade in illiquid contracts, the bid and asks are very scattered and less in number, so the user has very few options to decide from whether to trade or not from 5-Depth data. Let’s take a particular example of MefCon Capital Markets Ltd., from the figure given below, in the first figure we can see very few contracts that are available in the 5-Depth Data, but when we see at the 20-Depth Data we see that the user can decide whether to trade or not as he has more options available for the same, and hence will make the decision making better for him.
We at IIFL Securities want our customers to benefit by making informed decisions with a better understanding of the market therefore we strive to provide the best services. When we talk about the market depth feature, most brokers offer only the best 5 bids & the best 5 asks and only premium customers or those who pay more are given access to the 20-Depth feature. At IIFL we provide all our clients the best and everyone has the access to the 20-Depth on their fingertips for no extra cost. The bids are updated in real-time and there are 2 parameters which are covered; best 20 bids (their price and quantity), best 20 asks (their price and quantity).
So what are you waiting for, learn at your own convenience and Invest Right with IIFL!
Topic Participants
Kajal Kumari
Sticky Posts
Introducing IIFL Ideas
Let's Understand the Current Scenario Ever looked at graphs of red and green columns and felt entirely clueless? Received random stock recommendations from people and then got confused? There are a lot of sources from which you can get a recommendation.Introduction to 20-Market Depth
Market Depth Market depth is expressed as the list of limit orders placed at different price levels for a particular security. It consists of 2 parts- Bid and Asks where Bid shows the number of Buy orders placed at a price level and Ask shows the number